
You're constantly riding a rollercoaster. You see the 'C' market price shoot up, and you panic about your cost of goods. You see it crash, and you wonder if you should have waited to buy. This volatility is a massive pain point. You're trying to run a stable business, but you're at the mercy of a market that seems chaotic and unpredictable. You're worried about making a bad call—buying at the peak or missing the bottom—that could erase your profits for the quarter. You need a way to bring some order to the chaos.
Honestly, you cannot predict coffee price movements with 100% certainty, but you can significantly improve your odds by analyzing three key categories of data: 1) Technical Analysis of price charts to identify trends and patterns, 2) Fundamental Analysis of global supply and demand factors (like weather and economic data), and 3) Sentiment Analysis of market news and reports. By combining these three approaches, you can move from reactive gambling to proactive, data-driven purchasing.
I've learned this lesson the hard way over the years. Relying on gut feeling alone is a recipe for disaster. Now, our team at Shanghai Fumao spends a significant amount of time analyzing data to guide our selling and hedging strategies. It's about replacing fear with a strategic framework. Let's break down how you can use data to make more intelligent buying decisions.
Can Chart Patterns Really Predict the Future?
When you first look at a financial chart, it can seem like random noise. But to a trained eye, the patterns in those charts tell a story about the psychology of the market—the battle between buyers (bulls) and sellers (bears). This is the world of Technical Analysis.
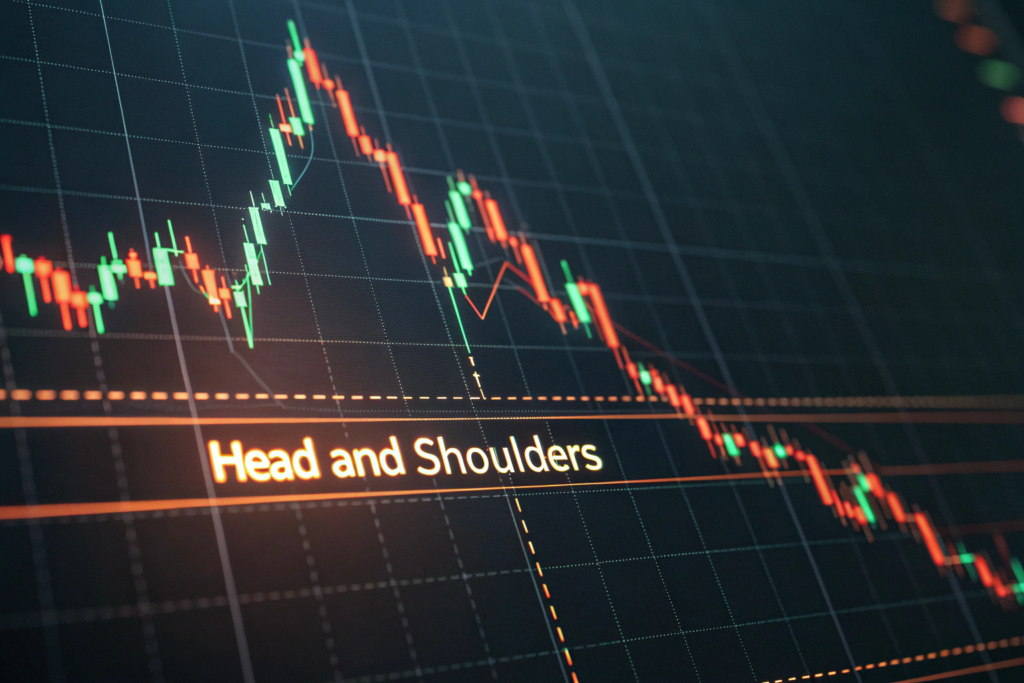
Isn't looking at charts just like reading tea leaves? Not at all. Technical Analysis is the study of historical price action to identify recurring patterns and probabilities. Key patterns like "Support and Resistance," "Head and Shoulders," and "Moving Averages" provide objective, data-based signals about where the price is likely to go next. It's a game of probabilities, not prophecy.
Think of it this way: these patterns work because millions of traders around the world are looking at the same charts and reacting to the same signals. It becomes a self-fulfilling prophecy. By understanding the basics, you can anticipate these mass movements instead of being surprised by them.
What are Support and Resistance levels?
These are the most fundamental concepts in technical analysis.
- Support: A price level where a downtrend tends to pause or reverse due to a concentration of buying interest. Think of it as a historical price "floor." When the price approaches a strong support level, it's often a signal that a buying opportunity is near.
- Resistance: A price level where an uptrend tends to pause or reverse due to a concentration of selling interest. Think of it as a price "ceiling."
You can identify these levels simply by looking at a historical price chart and drawing horizontal lines where the price has repeatedly struggled to break through.
What is a Moving Average?
A Moving Average (MA) smooths out price data to create a single flowing line, making it easier to identify the direction of the trend. A common strategy is to use two moving averages, a short-term one (like a 50-day MA) and a long-term one (like a 200-day MA). When the short-term MA crosses above the long-term MA (a "Golden Cross"), it's considered a strong bullish signal (prices likely to go up). When it crosses below (a "Death Cross"), it's a bearish signal. This is a simple, powerful tool for trend identification.
What Real-World Data Drives the Market?
Charts only tell you what is happening. To understand why it's happening, you need to look at the real-world fundamentals of supply and demand. This is Fundamental Analysis, and it's what gives context to the patterns you see on the charts.
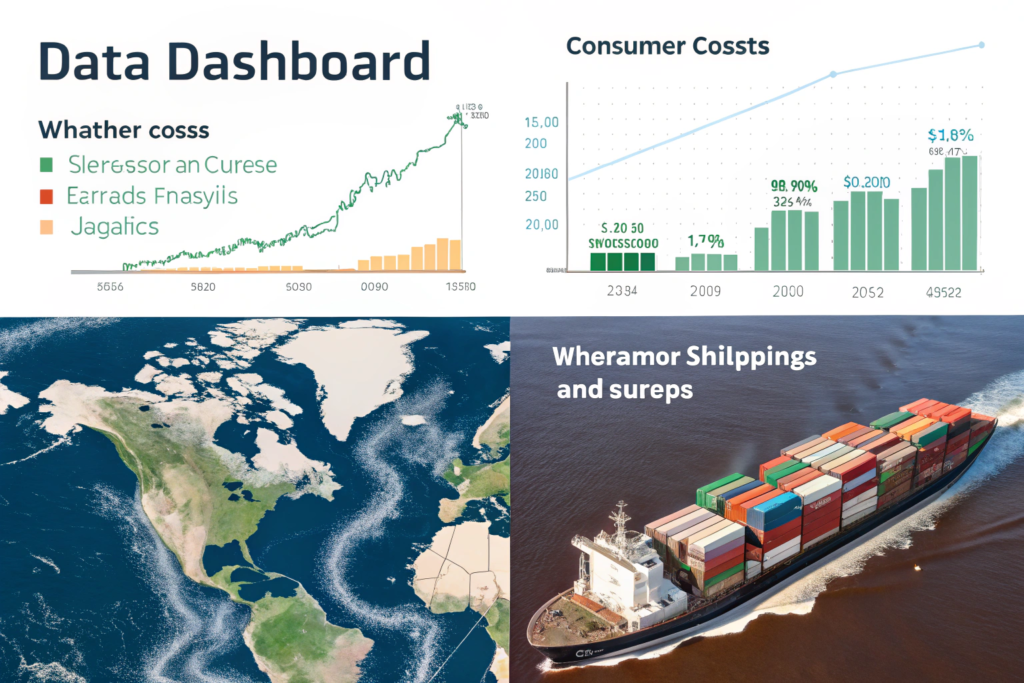
Isn't the price just about supply and demand? Yes, and tracking the data that influences them is the core of fundamental analysis. The most critical data points to watch are weather forecasts in key growing regions (especially Brazil), global economic indicators (like consumer spending), and currency exchange rates (particularly the USD/BRL).
A sudden frost in Brazil can send prices soaring overnight, regardless of what the charts were saying. A recession in Europe can curb demand and cause prices to fall. These fundamental factors are the powerful currents that move the entire market.
What is the most important supply-side data?
Without a doubt, it's the weather in Brazil. As the world's largest Arabica producer, any threat to their crop has an outsized impact on the global price. You should be tracking frost forecasts during the Brazilian winter (May-August) and rainfall data during their growing season. Other key data includes crop forecasts from Vietnam (the largest Robusta producer) and reports on the prevalence of diseases like coffee leaf rust in Central America.
What demand-side data should you watch?
The health of the economies in the United States and the European Union is paramount. Data points like consumer confidence reports, retail sales figures, and unemployment rates can signal future coffee demand. Also, watch the USD/BRL exchange rate. A stronger US dollar against the Brazilian Real incentivizes Brazilian farmers to sell more coffee (as they get more of their local currency for each dollar's worth of coffee), which can put downward pressure on prices.
How Do You Gauge What the Market is Thinking?
Even with perfect charts and fundamental data, there's a third, more intangible factor: market sentiment. This is the overall mood or feeling of traders and large institutional investors. Sometimes, the market moves simply because a critical mass of people believes it will move.
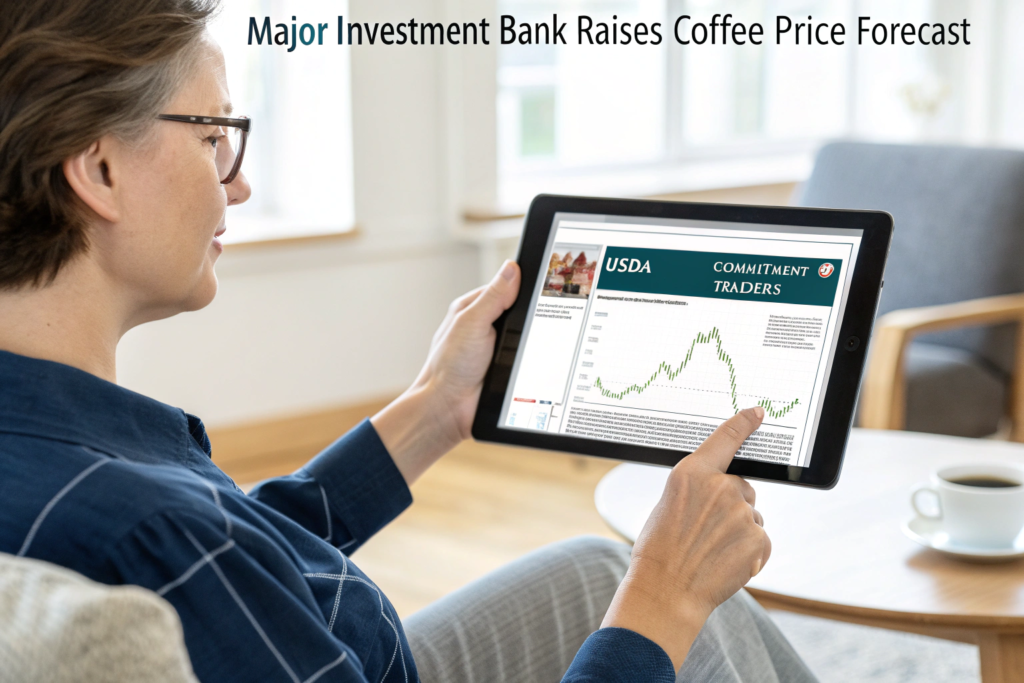
Isn't it impossible to know what everyone is thinking? It's difficult, but you can get clues through Sentiment Analysis. This involves analyzing news reports, major bank forecasts, and, most importantly, the Commitment of Traders (COT) report. This data helps you understand whether the "big money" is betting on prices going up or down.
If a major investment bank releases a report predicting higher coffee prices, it can become a self-fulfilling prophecy as traders pile in. Conversely, a bearish government report can spook the market. Gauging this sentiment helps you avoid fighting against a powerful market tide.
What is the Commitment of Traders (COT) report?
The COT report is a weekly publication from the U.S. government that shows the trading positions of different groups in the futures market. The most important group to watch is the "Managed Money" or "Large Speculators" (i.e., hedge funds). If you see that this group is building a large "net long" position, it means they are overwhelmingly betting on higher prices. If they are building a "net short" position, they are betting on a fall. This is a powerful look inside the minds of the market's biggest players.
Where can you find reliable market news?
Beyond major financial news outlets like Reuters and Bloomberg, you should follow industry-specific publications. Reports from the USDA (United States Department of Agriculture) and the ICO (International Coffee Organization) provide some of the most respected and market-moving forecasts on global coffee production and consumption. Subscribing to their free reports is essential.
How Do You Put It All Together?
Having all this data is one thing; using it to make a decision is another. The real power comes from combining all three types of analysis to build a convincing, multi-layered case for a purchasing decision.
Should you use all three types of analysis together? Yes, always. The strongest trading signals occur when technical, fundamental, and sentiment analysis all align. For example, if the price is bouncing off a strong technical support level, and there's fundamental news of a drought in a key region, and the COT report shows hedge funds are increasing their long positions, you have a very powerful buy signal.
You don't need to be right 100% of the time. You just need a system that puts the odds in your favor. By waiting for these moments of "confluence," where multiple data sources are telling you the same story, you dramatically increase your chances of making a profitable decision. It's how you build a disciplined, professional purchasing strategy.
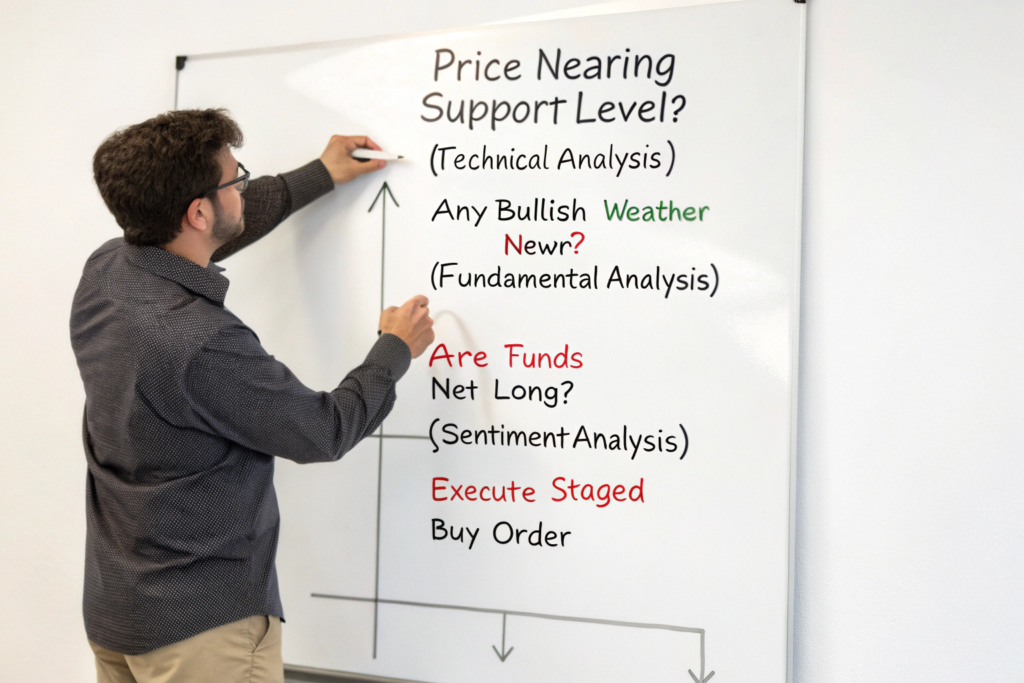
What does a simple strategy look like?
- Technical: Identify key weekly support levels on the price chart. Decide you will only consider buying when the price is near these levels.
- Fundamental: As the price approaches your support level, check the news. Is there any bullish fundamental data (e.g., bad weather, strong economic reports) that supports the idea of a price bounce?
- Sentiment: Check the latest COT report. Are the large speculators generally bullish (net long)?
- Action: If all three align, you execute your purchase. If they don't (e.g., the price is at support, but the news is bearish and funds are selling), you wait for a better opportunity.
How can a supplier help?
A good supplier, like us at Shanghai Fumao, is your partner on the ground. We can provide you with real-time information about our crop in Yunnan, local market conditions, and logistical updates that you can't get from a chart or a news report. This "on-the-ground intelligence" is a valuable piece of your analytical puzzle.
Conclusion
Predicting coffee prices is a complex puzzle, but it is not random. By developing a disciplined approach that combines technical analysis of charts, fundamental analysis of real-world events, and sentiment analysis of market psychology, you can transform yourself from a price-taker into a strategic, data-driven buyer. It's about shifting your mindset from guessing to assessing probabilities. This approach won't make you perfect, but it will give you a significant edge, reduce your risk, and ultimately make your business more resilient and profitable.
We believe that an informed partner is a better partner. We are always ready to share our market insights and on-the-ground knowledge to help you make the best possible sourcing decisions. If you're looking for a supplier who understands the market and is committed to your success, let's connect. Contact our coffee specialist at cathy@beanofcoffee.com to start the conversation.