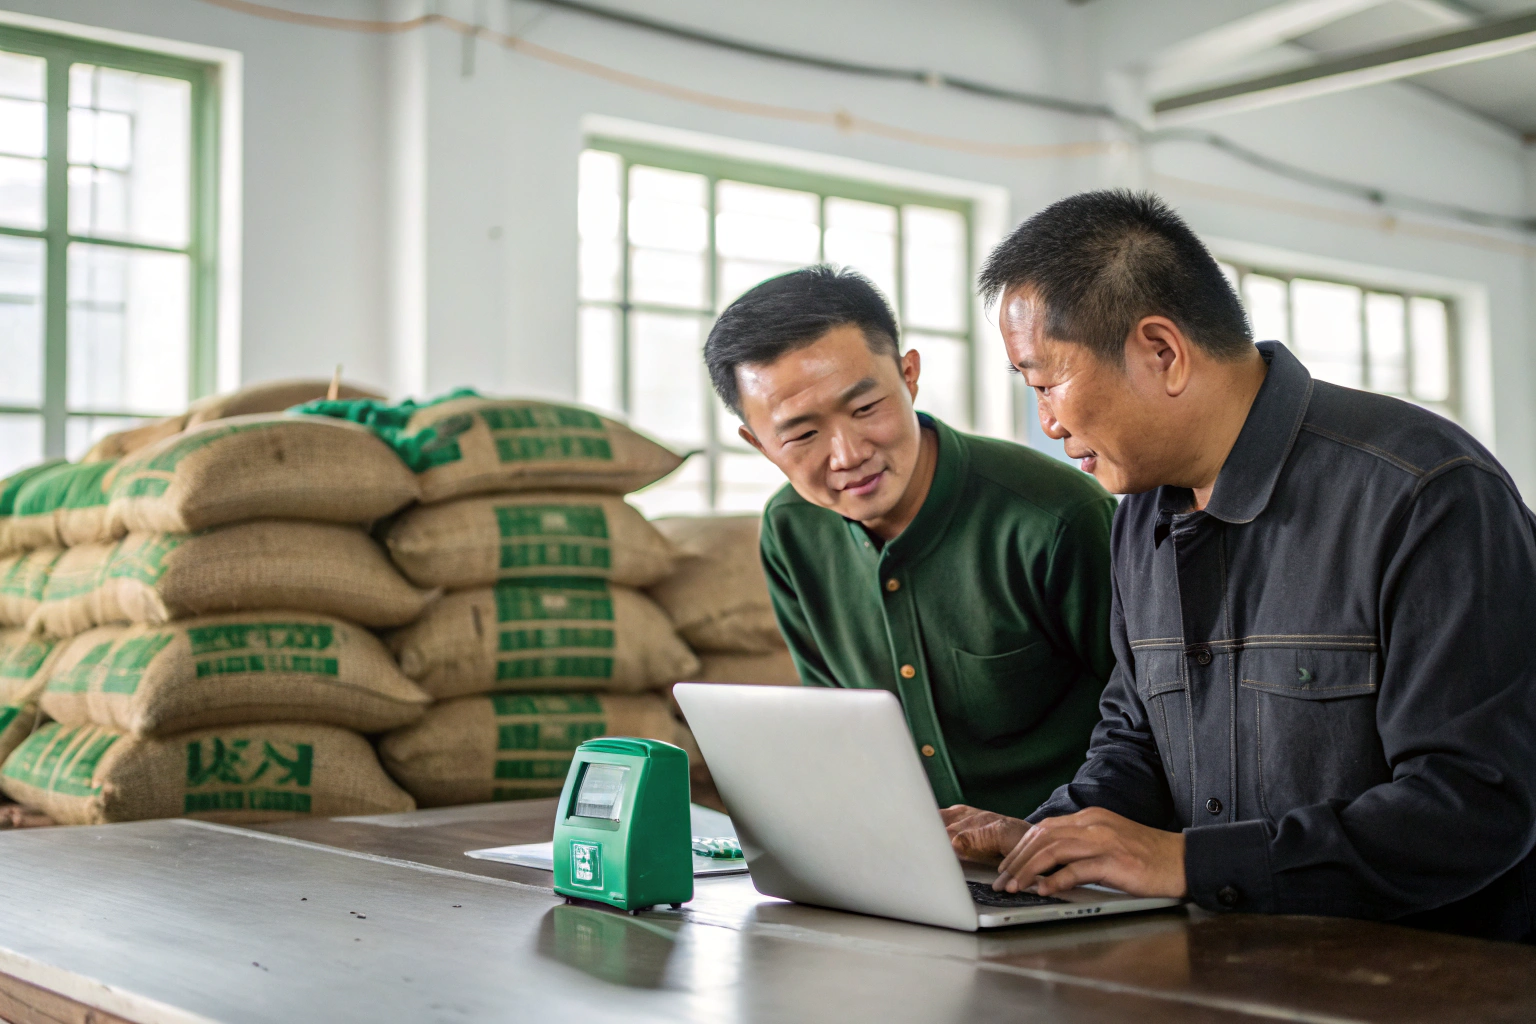
You buy coffee. You want good quality. You want a fair price. But more buyers now ask a new question. What is the carbon footprint of this lot? If you cannot answer, you lose the deal. That is the problem. Carbon intensity is becoming a buying criterion. Not just in Europe. In North America and Australia too. Retailers ask. Roasters ask. Even shipping lines ask. So you need to understand where emissions come from and how to reduce them.
You can reduce the carbon intensity of your coffee sourcing by focusing on three areas: farm-level emissions, transport emissions, and supply chain efficiency. Farm-level emissions account for 75% to 91% of coffee’s total carbon footprint, with fertilizer use and land-use change as the main drivers. Transport adds another 10% to 20%, depending on the mode. By choosing regenerative farms, switching to biofuel ocean freight, and using carbon footprint tools, you can cut emissions by 30% to 45%. At BeanofCoffee, we track moisture, density, and origin data on every Yunnan lot. That data feeds into the carbon calculations our buyers need.
So, where do you start? And what actually works? Let me walk you through the real numbers. I have shipped coffee for years. I have watched the carbon conversation shift from marketing to contracts. Let me share what I know.
What Drives Carbon Emissions in Coffee Sourcing?
You may think transport is the biggest problem. It is not. The farm is. Most emissions happen before the coffee even leaves the origin. That changes how you should think about reduction. Let me show you the breakdown.
Farm-level activities account for 75% to 91% of coffee’s total carbon footprint. Fertilizer production and application are the largest single source, contributing 65% to 100% of farm emissions in most studies. Land-use change and deforestation come second. Processing, transport, roasting, and packaging make up the rest. This means the biggest reduction opportunities are at the farm, not in the shipping container.
A meta-analysis published in Environmental Reviews found that the median product carbon footprint of coffee production is 2.18 kg CO2e per kg of green beans. The median area carbon footprint is 2,954 kg CO2e per hectare per year. Nitrogen fertilizers are the main emissions source in almost every study. The CDP report on coffee confirms that 75% to 91% of emissions come before the beans leave the farm. So, what does this mean? It means if you only focus on shipping, you miss the biggest problem. You need to work with farmers on fertilizer, shade, and soil.
| Emission Source | Share of Total Footprint | Main Driver |
|---|---|---|
| Fertilizer production | 30-50% | Nitrogen fertilizers |
| Land-use change | 10-30% | Deforestation |
| Processing | 5-15% | Wet milling wastewater |
| Transport | 10-20% | Ocean or air freight |
| Roasting and packaging | 5-10% | Energy use |

How Does Fertilizer Drive Coffee’s Carbon Footprint?
Fertilizer is the biggest single source. Nitrogen fertilizers produce nitrous oxide, a greenhouse gas 273 times more potent than CO2. The manufacture of fertilizer also uses a lot of energy. The meta-analysis found that fertilizer manufacture and application account for 65% to 100% of total farm emissions. The FAO overview of carbon footprint reduction recommends precision agriculture and optimized fertilization as key strategies. The 4C carbon footprint solution helps farmers measure and reduce fertilizer emissions. I work with farms that use organic nitrogen sources and cover crops. These practices cut emissions and improve soil. So, the first question for any supplier should be: what fertilizer do you use, and how much?
How Does Land-Use Change Affect Emissions?
Land-use change means clearing forest for coffee. When trees are cut, stored carbon is released. This can be a huge one-time emission. The EU Deforestation Regulation now requires proof that coffee is deforestation-free. The Nestlé Vietnam program collected over 40,000 land polygons to prove compliance. I collect GPS coordinates for every farm in our Yunnan network. That data proves the land was not deforested. It also supports carbon calculations. So, ask for geolocation data. If the supplier cannot provide it, that is a red flag.
How Do Regenerative Farming Practices Cut Emissions?
You may think farming practices are the farmer’s problem. They are not. They are your problem too. If the farm emits less, your coffee’s carbon intensity drops. That makes your product more attractive. And it may command a premium. Let me show you what works.
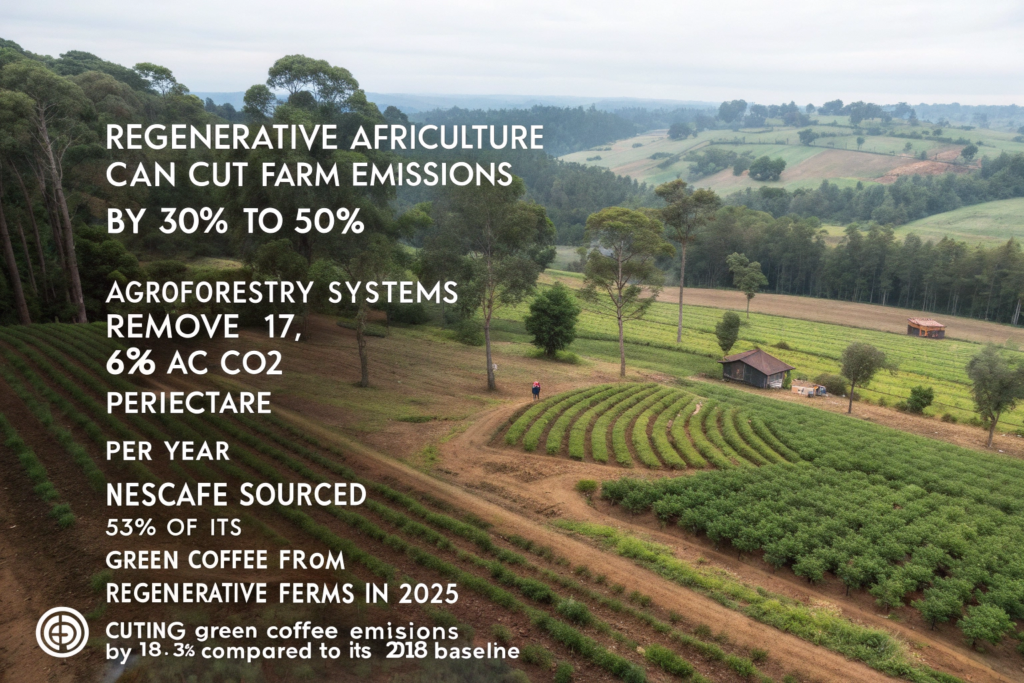
Regenerative agriculture can cut farm emissions by 30% to 50% and increase carbon sequestration. Key practices include agroforestry, cover cropping, optimized fertilization, and reduced tillage. The Environmental Reviews meta-analysis found that agroforestry systems remove 17,676 kg CO2 per hectare per year, compared to 6,990 kg for unshaded systems. Nescafé sourced 53% of its green coffee from regenerative farms in 2025 and cut green coffee emissions by 18.3% compared to its 2018 baseline.
The Nescafé Plan 2030 progress report states that agroforestry, cover cropping, and optimized fertilization are the core practices. The Nestlé Vietnam program found that retaining weeds and mowing them instead of removing them eliminated glyphosate residue issues and added organic matter. Water-saving irrigation reduced water use by 40% to 60%. So, what does this mean? It means regenerative practices are not just good for the planet. They are good for quality, compliance, and cost.
| Regenerative Practice | Carbon Benefit | Other Benefits |
|---|---|---|
| Agroforestry | 17,676 kg CO2/ha/year removal | Shade, biodiversity |
| Cover cropping | Reduced erosion, soil carbon | Weed control |
| Optimized fertilization | Lower N2O emissions | Cost savings |
| Reduced tillage | Soil carbon retention | Better soil structure |
| Water management | Lower pumping energy | Drought resilience |
How Does Agroforestry Increase Carbon Removal?
Agroforestry means growing coffee with shade trees. The trees absorb CO2. They drop leaves that feed the soil. They cool the air. The Environmental Reviews meta-analysis found that agroforestry systems remove 17,676 kg CO2 per hectare per year. That is more than double the removal rate of unshaded systems. A separate meta-analysis in FAO AGRIS found that diversified agroforestry systems had a positive effect on soil carbon stock change rates. The Rainforest Alliance promotes shade management as a core standard. I visit farms with shade trees. The beans are denser. The flavor is better. So, agroforestry is a win for carbon and a win for cup quality.
How Do Cover Crops and Reduced Tillage Help?
Cover crops protect the soil. They add organic matter. They reduce erosion. Reduced tillage keeps carbon in the soil. The FAO regenerative agriculture guide explains that these practices build soil health and increase carbon storage. Nestlé Vietnam found that mowing weeds instead of removing them eliminated glyphosate residue issues. The Nescafé Plan supports these practices with field training. I have seen farms reduce fertilizer use by 20% to 30% after adopting cover crops. That cuts both cost and emissions. So, ask your supplier about their soil practices. The answers tell you a lot.
Can You Cut Emissions During Transport and Logistics?
You may think transport is a small part of the footprint. It is smaller than farming. But it is still significant. And it is often the easiest place to start. You can choose a greener carrier. You can consolidate shipments. You can switch modes. Let me show you the options.
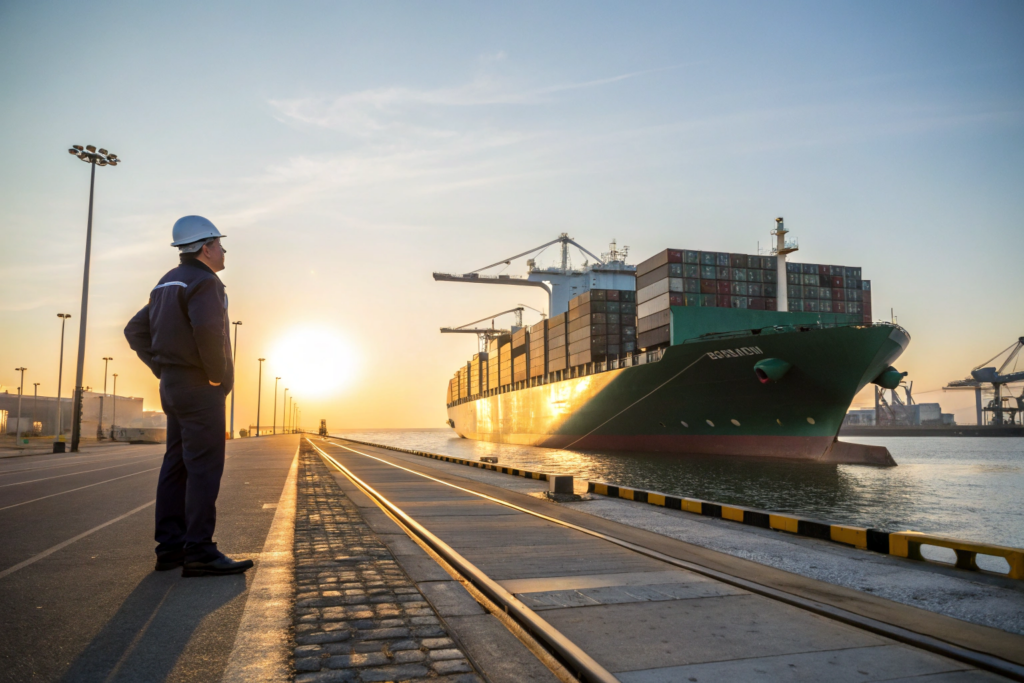
Transport accounts for 10% to 20% of coffee’s carbon footprint, depending on the mode and distance. Ocean freight by biofuel can cut transport emissions by 90%. Sail cargo can achieve an 84% to 95% reduction compared to average container carriers. Air freight is the worst option, contributing up to 46% of total emissions for a single shipment. Switching from air to ocean or from conventional fuel to biofuel is the fastest way to lower transport emissions.
The Paulig case study shows that switching to biofuel for ocean imports cut emissions by 90% and saved 10,000 tonnes of CO2 per year. The Origin Coffee Shipped by Sail project uses wind-powered vessels and achieves an 84% to 95% reduction. A study of Indian Robusta found that sea transport contributed 66% of the carbon footprint in one scenario. Air freight contributed 46% in another. So, the mode matters more than the distance.
| Transport Mode | Emission Level | Best For |
|---|---|---|
| Air freight | Very high | Samples only |
| Conventional ocean | Medium | Standard shipments |
| Biofuel ocean | Low | Regular volumes |
| Sail cargo | Very low | Premium lots |
Why Is Air Freight So Bad for Coffee Carbon?
Air freight produces far more emissions per tonne-kilometer than ocean freight. The Uganda coffee value chain study found that air freight contributed approximately 46% of total emissions for coffee exports. Sea freight contributed only 16%. The CDP report states that a single 12 oz black coffee generates about 0.258 kg CO2e, while a latte generates 0.844 kg CO2e because of dairy production. Air freight adds a lot more. So, what does this mean? It means you should avoid air freight for full orders. Use it only for samples and urgent micro-lots. For everything else, ocean freight is the better choice.
How Do Biofuels and Sail Cargo Work for Coffee?
Biofuels are a drop-in solution. You do not need new ships. You buy biofuel certificates or pay a premium for biofuel-powered voyages. The Paulig case study uses a mass balance system. Not every vessel runs on biofuel, but Paulig purchases the equivalent amount. This guarantees emission reductions. Sail cargo is smaller scale. The Origin Coffee project ships regeneratively grown beans from Brazil to the UK on wind-powered vessels. It is slower. But it cuts emissions by 84% to 95%. So, ask your freight forwarder about biofuel options. Ask about sail cargo for premium lots. These options exist. They work.
What Tools Help You Measure and Reduce Carbon?
You cannot reduce what you cannot measure. You need data. You need tools. You need a baseline. The good news is that the coffee industry now has standard tools. You do not need to build your own. Let me show you what is available.
The main tools for measuring coffee carbon footprints are the 4C Carbon Footprint Add-On, ISO 14067, and the GHG Protocol Product Standard. The 4C solution calculates emissions across the entire coffee supply chain, supports mitigation planning, and monitors reductions. It is certified by an independent third party. Nescafé uses its own measurement system and has cut green coffee emissions by 18.3%. You can also use the Terrascope methodology from the CDP report.
The 4C carbon footprint solution is designed specifically for coffee. It covers cultivation, processing, and transport. It has four implementation levels. Level one is measurement. Level two adds supply chain factors. Level three focuses on reduction. Level four includes carbon offsets. The China zero-carbon coffee standard also provides a framework. So, what does this mean? It means you can start measuring today. Pick a tool. Set a baseline. Then reduce.
| Tool | Scope | Best For |
|---|---|---|
| 4C Carbon Footprint Add-On | Full supply chain | Certification and reduction |
| ISO 14067 | Product carbon footprint | Standardized measurement |
| GHG Protocol | Corporate and product | Broad application |
| Terrascope | Coffee value chain | Hotspot analysis |

How Do You Set a Carbon Baseline?
A baseline is your starting point. You measure your current emissions. Then you set a target. The 4C solution requires a baseline GHG calculation before you apply for certification. The Nescafé Plan 2030 uses 2018 as its baseline. I helped a buyer set a baseline last year. We measured farm emissions, processing, and transport for three lots. It took two weeks. The data showed that fertilizer was 40% of total emissions. That gave us a clear target. So, start with one origin. Measure one lot. Then expand. Do not wait for perfect data. Start with what you have.
How Do You Track Progress Over Time?
Tracking progress needs consistency. Use the same method every year. The 4C solution monitors emission reductions over time. Nestlé reported an 18.3% reduction from its 2018 baseline. That took six years of consistent work. The Global Coffee Alliance 2026 Declaration aims for 100% of member cultivation areas to meet regenerative agriculture standards by 2040. That is a long-term goal. I track carbon data every season. I compare it to the previous year. I share the progress with my buyers. So, make carbon a KPI. Then report on it. That is how you build trust.
Conclusion
Reducing the carbon intensity of your coffee sourcing is possible. The biggest wins are at the farm: regenerative agriculture, optimized fertilizer, and agroforestry. Transport is next: switch to biofuel ocean freight and avoid air freight. Then measure everything with a standard tool. Set a baseline. Track progress. Share the data with your buyers. These steps cut emissions. They also cut costs. They open new markets. And they protect your supply.
If you want a supplier who tracks carbon data and supports regenerative practices, contact us. BeanofCoffee owns over 10,000 acres in Baoshan, Yunnan. We export Catimor, Arabica, and Robusta to North America, Europe, and Australia. We can share farm GPS data, moisture reports, and carbon footprint information. For orders or questions, email Cathy Cai at cathy@beanofcoffee.com. She will help you build a lower-carbon supply chain.