
I run BeanofCoffee, a coffee exporter in Yunnan, China. We own more than 10,000 acres in Baoshan City. We sell Catimor, Arabica, and Robusta. We ship to North America, Europe, and Australia. Buyers like Ron ask me how to choose the right coffee. Ron is 44. He owns a company in America. He cares about price and timeliness. He sources on Google, Alibaba, and at trade shows. He is confident. He likes to lead. But he also knows that guessing is expensive. A bad lot costs money. A late container costs customers. A wrong origin costs trust. So he wants data. Not stories. Analytics can give him that. But only if he uses it the right way.
Analytics improves coffee sourcing by turning scattered numbers into clear patterns. You can track moisture, cupping scores, defect rates, freight times, tariffs, supplier response times, and reorder history. Then you can compare suppliers fairly. You can see which one is cheap but slow. Which one is fast but risky. Which one is consistent. You can also predict demand and plan shipments earlier. The goal is not to collect every number. The goal is to make better decisions with the numbers you have. Start small. Track five key metrics. Review them monthly. Then adjust your buying plan.
So, what should you do next? Do not buy a big software system on day one. Use a spreadsheet. Use a notebook. Use your own records. Then add tools as you grow. At BeanofCoffee, we share data with buyers because we want them to plan better. A buyer with good data is a better partner. Let me show you how to use analytics in your coffee sourcing strategy.
Why Does Analytics Matter for Coffee Sourcing?
Coffee sourcing used to be simple. You found a supplier. You tasted the coffee. You agreed on a price. You waited. Then you hoped. But today the market moves faster. Prices swing. Shipping changes. Tariffs shift. Weather shocks happen. If you only use your gut, you will be late. You will overpay. You will miss quality. Ron told me he used to buy on instinct. Then he had two bad shipments in one year. Now he tracks everything. That change saved his margin.
Analytics matters for coffee sourcing because it reduces uncertainty. It shows you which suppliers deliver on time. It shows you which lots match the sample. It shows you where the real cost sits. It also shows you when to buy and when to wait. A simple scorecard can reveal a supplier who is cheap but unreliable. A simple chart can show a freight route that is slow in winter. A simple log can show a moisture problem before it becomes a claim. So analytics is not a luxury. It is a shield.
Another way to look at this is to compare sourcing to farming. A farmer who measures rain, soil, and temperature makes better decisions. A buyer who measures quality, time, and cost makes better decisions too. So measure. Then decide.

What Problems Can Sourcing Analytics Solve?
Sourcing analytics can solve several problems. It can solve late shipments. It can solve quality drift. It can solve hidden costs. It can solve supplier confusion. It can solve planning gaps. The International Coffee Organization tracks global production and trade. The Specialty Coffee Association explains quality standards and cupping. I use these when I build our own supplier reports. A problem you can measure is a problem you can fix. A problem you cannot measure will keep hurting you. So start with the biggest pain. Measure it. Then fix it. That is how analytics earns its place.
I also tell buyers to write down every problem. Date. Supplier. Lot. Issue. Cost. Then review the list each month. Patterns appear fast. A supplier with three late shipments is a risk. A supplier with three clean shipments is an asset. So track it. Then act.
How Does Data Reduce Coffee Sourcing Risk?
Data reduces sourcing risk by giving you early warning. A moisture reading warns you about mold. A freight update warns you about a delay. A cupping score warns you about quality drift. The USDA Foreign Agricultural Service shares crop and trade data. The World Bank commodity markets share price and market outlooks. I use these when I plan our own supply. A warning gives you time. Time gives you options. Options reduce risk. So do not wait for the problem. Look for the signal. Then act early.
For Ron, this means he should check data before he pays. He should check the moisture. He should check the vessel. He should check the supplier score. That habit protects his money. It also protects his customers.
What Data Should You Track in Coffee Sourcing?
You cannot track everything. If you try, you will drown. I have seen buyers build a fifty-column spreadsheet. They never use it. So keep it simple. Pick the metrics that change your decisions. Pick the metrics that predict a problem. Pick the metrics you can actually collect. Then track them every lot. That is how you build a habit. That is how you build value.
You should track five core areas in coffee sourcing: quality, logistics, cost, supplier performance, and demand. Quality includes moisture, defect count, screen size, and cupping score. Logistics includes transit time, port delays, and seal integrity. Cost includes green bean price, freight, tariffs, and bank fees. Supplier performance includes on-time rate, response time, and claim rate. Demand includes your own sales, seasonality, and reorder points. These five areas cover most sourcing decisions.
So, what should you do? Build a simple sheet. One row per lot. One column per metric. Then review it monthly. That sheet becomes your memory. It also becomes your negotiation tool. So build it. Then use it.
Which Quality Metrics Matter Most?
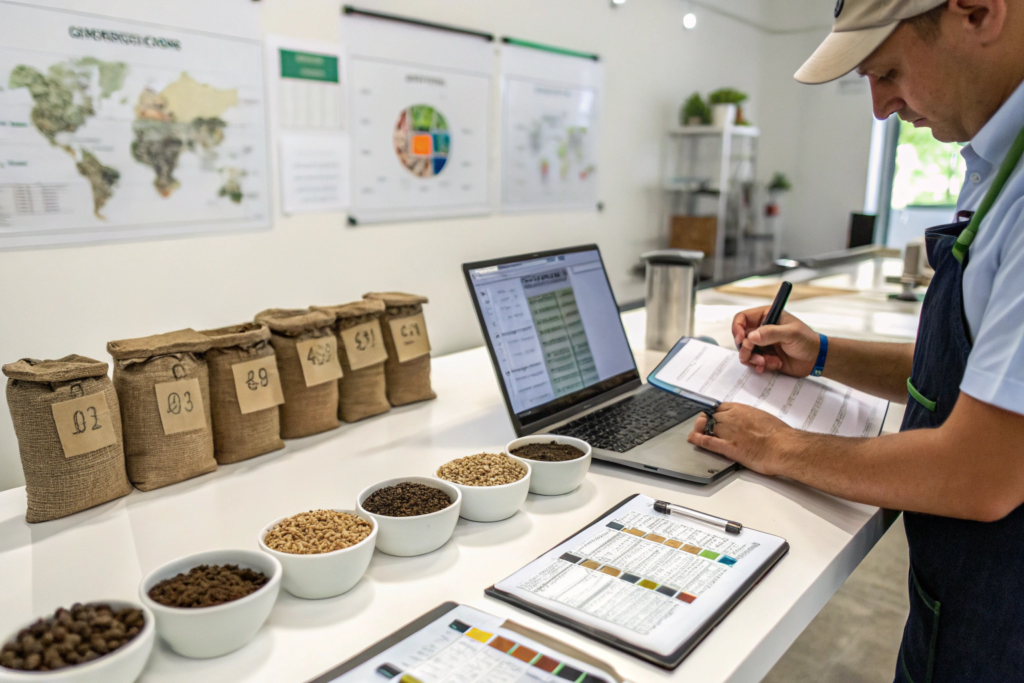
Moisture, defect count, screen size, and cupping score matter most. Moisture predicts mold and weight loss. Defect count predicts cup cleanliness. Screen size predicts roast consistency. Cupping score predicts flavor and price. The Coffee Quality Institute trains graders and cuppers. The SGS coffee inspection page shows how third parties test quality. I use these when we prepare our export files. A quality metric is not a marketing number. It is a decision tool. So track it. Then compare it. That is how you spot drift before it hurts.
I also tell buyers to keep a sample from every lot. Label it. Store it. Then cup it later. A sample is proof. A memory is not. So keep samples. Then use them.
How Do You Track Logistics and Cost Data?
You track logistics by recording the container number, seal number, vessel name, departure date, arrival date, and port events. You track cost by recording the green bean price, freight rate, insurance, tariffs, bank fees, and inland trucking. The Freightos index shows freight rate trends. The Drewry shipping research tracks capacity and performance. I use these when I quote buyers. A cost number without a time number is incomplete. A time number without a cost number is incomplete. So track both. Then compare. That is how you find the real landed cost.
For Ron, this means he should compare suppliers on landed cost and on-time rate. The cheapest supplier may be the most expensive after delays. So look at both. Then decide.
How Do You Use Analytics to Compare Coffee Suppliers?
Comparing suppliers is hard. Every supplier says the same things. Good quality. Fast shipping. Fair price. But the data tells a different story. I have seen a supplier with great coffee and terrible documents. I have seen a supplier with great documents and average coffee. So you need a scorecard. A scorecard puts every supplier on the same scale. Then you can see the truth. Ron likes this because he is direct. He wants facts. A scorecard gives him facts.
You use analytics to compare suppliers by building a scorecard with weighted categories. Quality might count for 40%. Logistics might count for 25%. Cost might count for 20%. Communication and compliance might count for 15%. Then you score each supplier on the same metrics. The total score shows the best fit. A supplier with a high quality score and a low logistics score may work for filter coffee but not for a tight retail deadline. A supplier with a high logistics score and a low cost score may work for premium buyers. So match the score to your market.
So, what should you do? Build the scorecard. Use it every quarter. Then share the results with your team. A shared scorecard keeps everyone aligned. So build it. Then use it.

How Do You Build a Supplier Scorecard?
You build a supplier scorecard by choosing metrics, setting weights, scoring each supplier, and reviewing the results. The Trade.gov site offers export and import guidance. The Global Coffee Platform shares sustainable sourcing practices. I use these when I train our sales team. A good scorecard is simple. It has five to seven metrics. It uses a 1 to 5 scale. It is updated every quarter. A complex scorecard is ignored. A simple scorecard is used. So keep it simple. Then use it.
I also tell buyers to include a risk metric. A supplier with a single farm and no backup is a risk. A supplier with multiple mills and a backup plan is safer. So score the risk. Then decide.
Can Predictive Analytics Help with Coffee Demand?
Predictive analytics can help with coffee demand by showing patterns before they become obvious. You can use your own sales data, search trends, and market reports. The Perfect Daily Grind shares practical coffee business guides. The Daily Coffee News covers market trends and origin news. I use these when I plan our sample shipments. A demand forecast is not a guarantee. It is a guide. It helps you buy earlier. It helps you avoid stockouts. It also helps you avoid too much stock. So use it. Then review it. That is how you improve.
For Ron, this means he should track his own reorder data. If a blend sells faster every summer, he should buy earlier. If a blend slows down, he should buy less. That simple pattern is predictive analytics. So use it.
How Do You Turn Sourcing Analytics into Better Buying Decisions?
Data is only useful if it changes a decision. I have seen buyers collect beautiful reports and then do nothing. That is a waste. A report should lead to an action. Should you order more? Should you change suppliers? Should you book space earlier? Should you renegotiate? These are the questions. Analytics should answer them. Ron likes this because he wants speed. He wants clear choices. So let me show you how to turn data into action.
You turn sourcing analytics into better buying decisions by linking each metric to a rule. If moisture rises above a limit, reject the lot. If a supplier misses two dates, reduce volume. If freight rates rise, book early. If demand rises for three months, increase safety stock. If a supplier scores high for two quarters, offer a longer contract. Rules turn data into action. Action turns analytics into profit.
So, what should you do? Write down your rules. Keep them simple. Then follow them. A rule without action is just a wish. So write it. Then use it.

How Do You Set Reorder Points with Data?
You set reorder points by combining your sales speed, your lead time, and your safety stock. If sales are steady and lead time is long, keep more stock. If sales are rising and lead time is long, order earlier. If sales are falling, order less. The CBP page explains U.S. customs entry. The FDA prior notice page explains food import rules. I use these when I build a supply plan for buyers. A reorder point is not a guess. It is a calculation. So calculate it. Then review it every quarter. That is how you avoid stockouts.
I also tell buyers to add a buffer for Chinese New Year and winter transshipment. Those two events add delay every year. So plan for them. Then relax.
How Do You Review and Improve Your Sourcing Plan?
You review and improve your sourcing plan by checking your scorecard, your reorder points, your claim rate, and your cost per pound every quarter. The Rainforest Alliance explains sustainability standards. The Fairtrade website explains fair trade standards. I use these when I review our own supplier relationships. A quarterly review catches small problems before they become big. It also shows what is working. Then you can do more of it. So review. Then improve. That is how you build a better sourcing strategy.
For Ron, this means he should block one hour every quarter for a sourcing review. No phone calls. No interruptions. Just data. Then he makes three changes. Then he moves on. That habit keeps his supply strong.
Conclusion
Analytics is not a magic answer. It is a discipline. You track the right numbers. You compare suppliers fairly. You set rules for buying. You review your results. Then you improve. A buyer who does this will pay less, wait less, and worry less. A buyer who does not will keep guessing. I have seen both. The difference is not talent. It is habit. So build the habit. Start with five metrics. Then grow. At BeanofCoffee, we share data with buyers because we want them to succeed. We own more than 10,000 acres in Baoshan City, Yunnan. We export Catimor, Arabica, and Robusta. We work with large buyers, brand owners, distributors, and trading companies. If you want to improve your coffee sourcing strategy, please contact Cathy Cai at cathy@beanofcoffee.com. She will help you with samples, pricing, specifications, and supply data. You can also visit BeanofCoffee to learn more. Let us build a smarter coffee supply together.