A specialty buyer from Japan was visiting our Yunnan plantation last year and asked a question I had never been asked before. He wanted to know the TDS of the cherry juice from our Catimor trees. Not the extracted coffee. The juice inside the cherry itself. He explained that in Japan, some progressive buyers use cherry juice TDS as an early indicator of potential coffee quality months before the beans are even processed and dried. I was intrigued, and after studying the data, I became convinced that cherry juice TDS is one of the most underused quality prediction tools in the coffee industry. Let me walk you through what it is and why it matters.
What Is Total Dissolved Solids in Coffee Cherry Juice?
Total dissolved solids, or TDS, measures the concentration of soluble compounds in a liquid. In coffee cherry juice, those solids are primarily sugars — sucrose, glucose, and fructose — plus small amounts of organic acids, amino acids, and minerals. The TDS of cherry juice is essentially a measurement of the sugar content, which is the most important predictor of potential coffee quality.
How Is Cherry Juice TDS Different from Brix Measurement?
Brix and TDS are closely related but not identical. Brix measures only the sugar content by refractometry and is expressed in degrees Brix. TDS is a broader measurement that includes all dissolved solids, not just sugars. For coffee cherry juice, where sugars make up 90 to 95 percent of the soluble content, the two numbers are nearly interchangeable in practice. A Brix of 20 percent corresponds to a TDS of roughly 19 to 20 percent. The World Coffee Research cherry maturation study found that the average TDS of ripe Arabica cherry juice is 18 to 24 percent, with the peak quality range at 20 to 22 percent. Below 18 percent, the cherry is underripe and will produce beans with low sugar content and high Quaker risk. At Shanghai Fumao, our harvest teams use handheld refractometers to spot-check cherry ripeness across different sections of the plantation, and we delay harvest in any block where the average TDS is below 19 percent.
Why Does Cherry Juice TDS Correlate with Final Cup Quality?
The sugar content of the cherry juice is the raw material for everything that happens during roasting. Sugars fuel the Maillard reaction, produce caramelization, and create the sweet, complex flavors that define specialty coffee. A cherry with high TDS at harvest will produce a bean with more sucrose, which means more potential for flavor development during roasting. The Coffee Quality Institute's cherry quality study showed that the correlation between cherry juice TDS at harvest and final cupping score is 0.72, which is higher than the correlation with altitude or variety alone. A single TDS reading on 50 cherries from a lot can predict its quality potential with surprising accuracy. That is extraordinary power for a measurement that takes 15 seconds and costs nothing beyond the price of a 150 dollar refractometer.
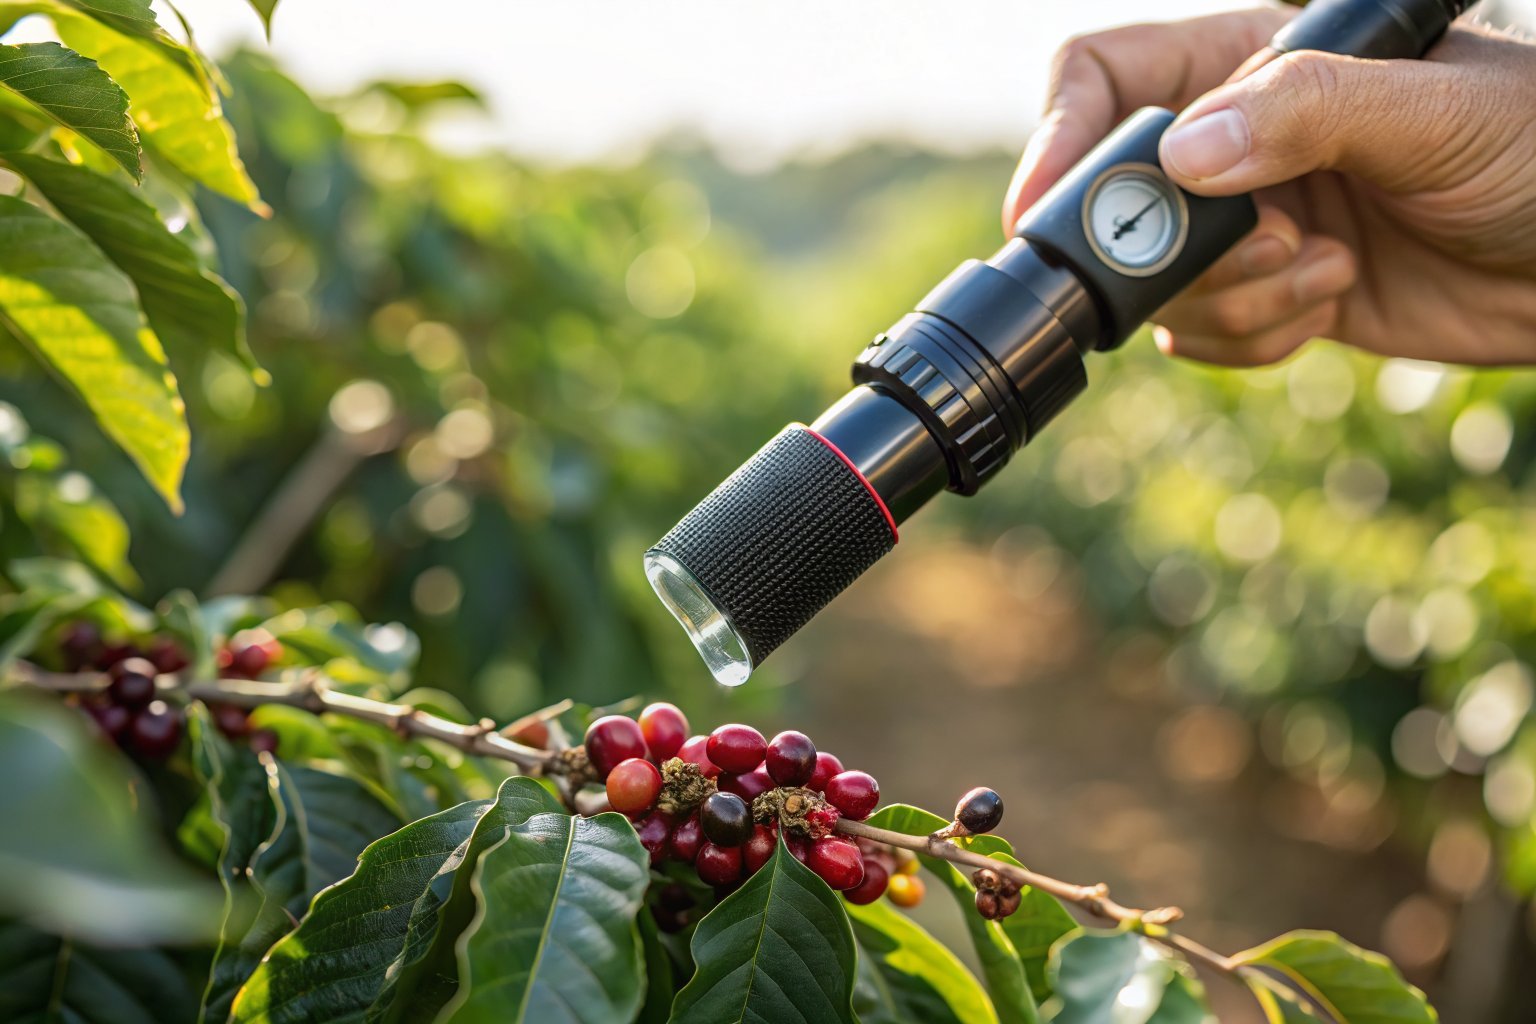
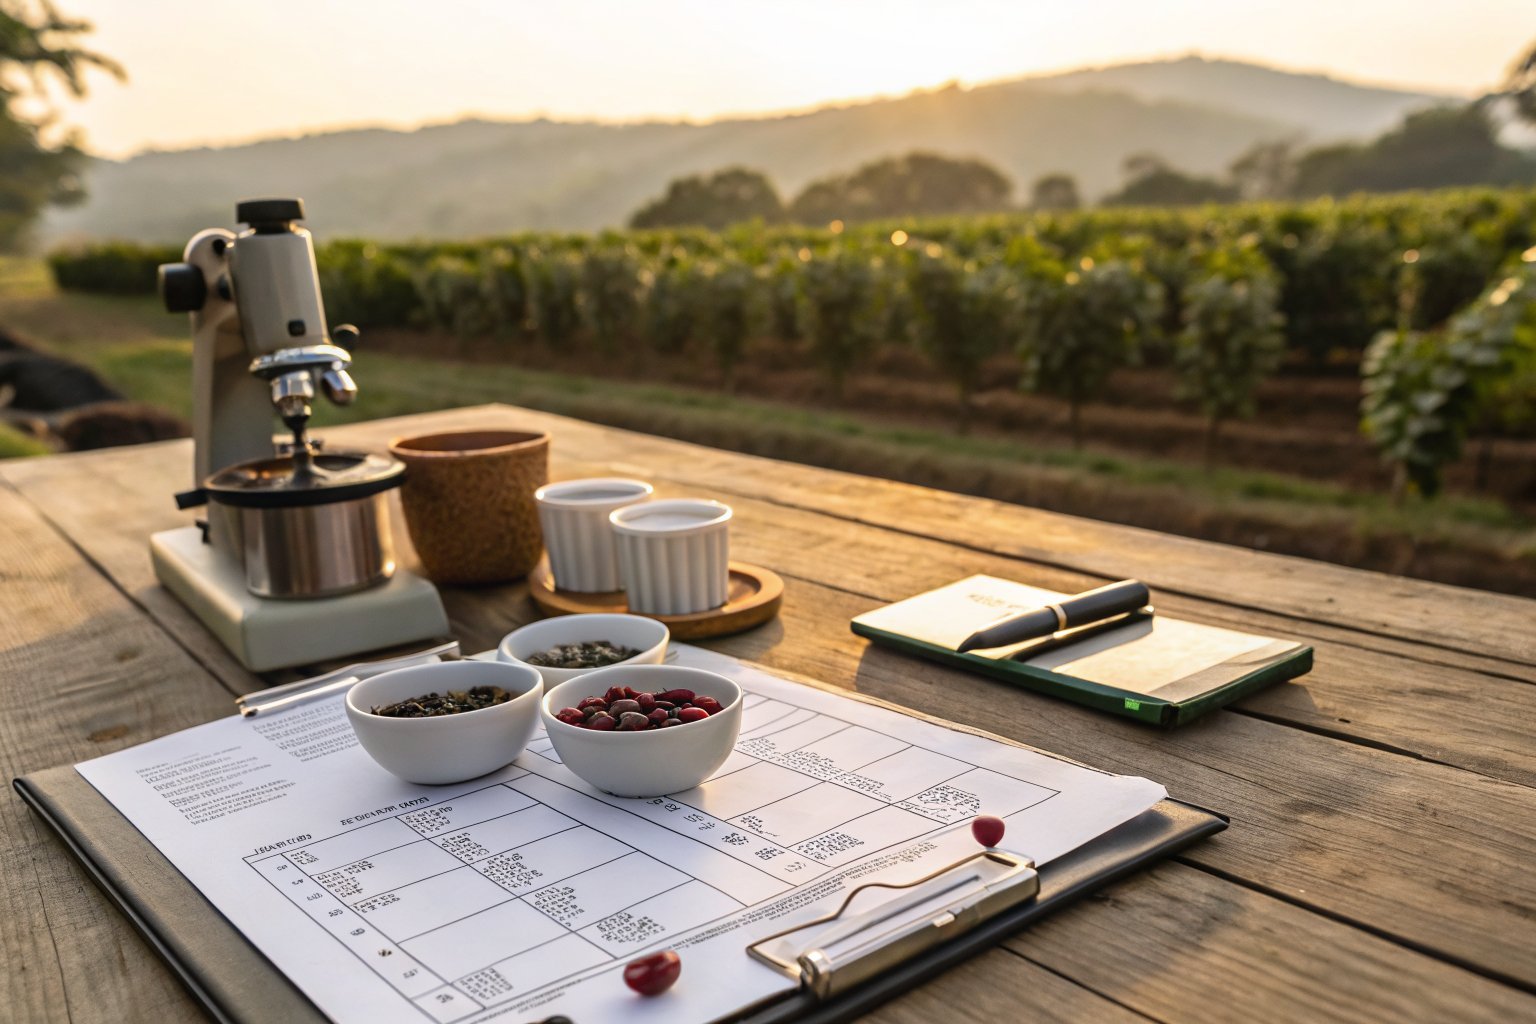
How Do You Measure Cherry Juice TDS in the Field?
You do not need a lab to measure cherry juice TDS. The equipment is simple and the technique takes five minutes to learn.
What Equipment Do You Need for Field TDS Measurement?
The essential tool is a digital refractometer with a range of 0 to 32 percent Brix or TDS. Analog refractometers work too, but digital models are more accurate and easier to use in bright outdoor light. You also need a small garlic press or citrus press to extract a drop of juice, a clean pipette or dropper, and distilled water for calibration. The Specialty Coffee Association's cherry sampling protocol recommends using a refractometer with an accuracy of plus or minus 0.2 percent. Digital units meeting this specification cost 100 to 300 dollars. Calibrate the refractometer with distilled water before each session, and clean the prism between each reading with a soft cloth.
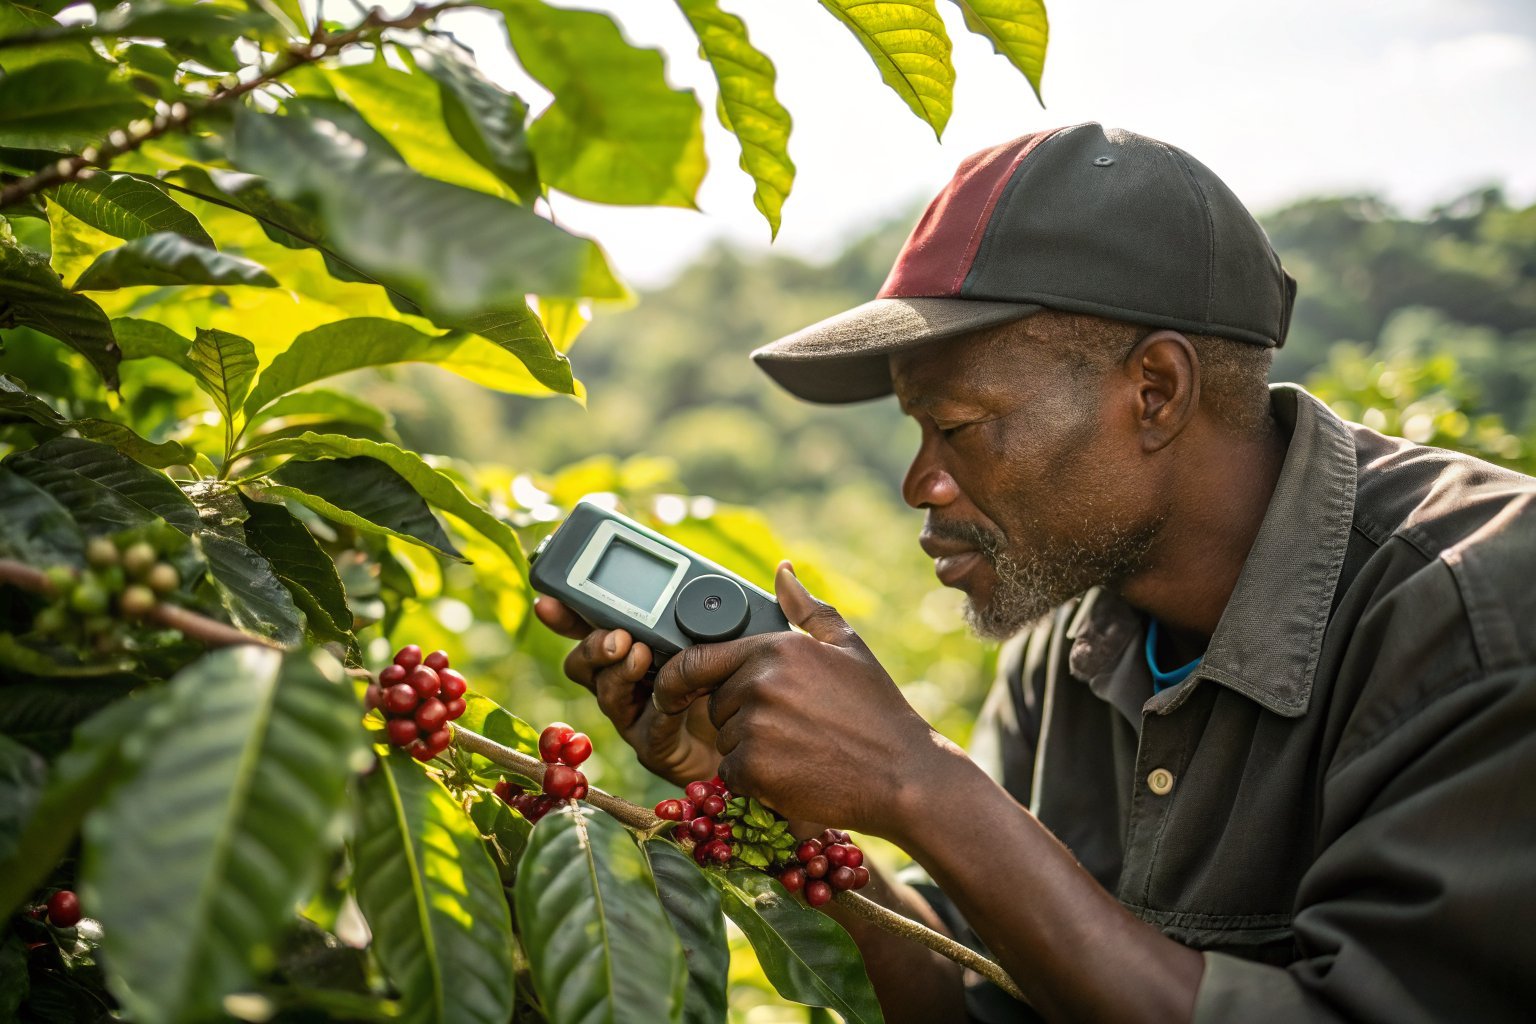
What Is the Correct Sampling Method for Reliable Results?
Sample at least 50 cherries from different parts of the tree and different trees within the same block. Pick only fully red cherries that would be harvested in a normal pass. Squeeze a few drops of juice from each cherry onto the refractometer prism and record the reading. Average the readings across all 50 cherries to get the block average. The World Coffee Research sampling guidelines specify that samples should be taken between 8 AM and 10 AM, before the midday heat changes the juice concentration. Do not sample cherries that are wet from rain or dew. Take separate samples from different elevations within the same farm if the altitude varies by more than 100 meters. The results will guide your harvest timing — pick the high-TDS blocks first and give the low-TDS blocks more time to ripen.
What Does a Good TDS Reading Look Like Across Different Origins?
The numbers vary by variety, altitude, and growing conditions. But there are established benchmarks that experienced buyers use to evaluate harvest quality.
What Is the Target TDS Range for Specialty-Grade Coffee?
The target TDS for fully ripe Arabica coffee cherry juice is 20 to 22 percent. Coffee in this range consistently produces specialty-grade beans with cupping scores of 84 to 87 points. Readings above 22 percent are excellent — these cherries are exceptionally sweet and often produce coffee scoring 88 points or above. Readings below 18 percent indicate underripe cherries that will have high Quaker counts and low cup potential. The International Coffee Organization's ripening standards report that the average TDS across all Arabica origins is approximately 20.5 percent. Ethiopian heirloom varieties tend toward the higher end at 21 to 23 percent, while Catimor varieties average 19 to 21 percent. At Shanghai Fumao, our Yunnan Catimor averages 20.2 percent at peak ripeness, which is at the lower end of the specialty range but well within acceptable limits.
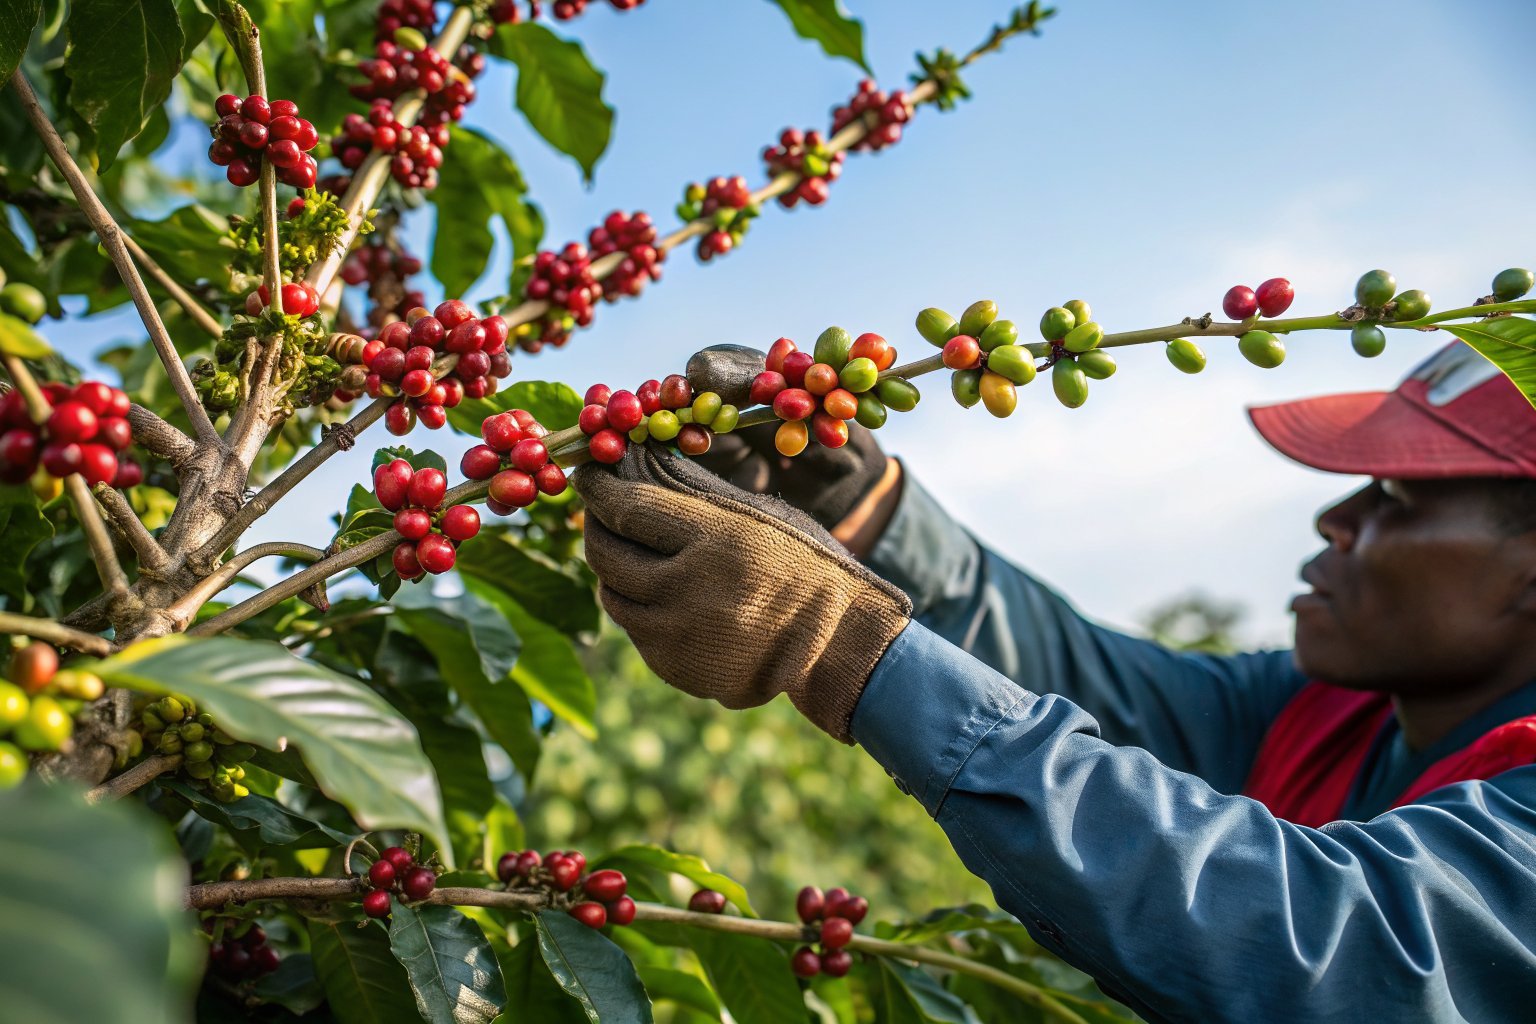
How Does TDS Vary Within a Single Tree or Field?
The variation can be surprising. A single coffee tree can have a TDS range of 4 to 5 percent between the sun-exposed side and the shaded side. The sun-exposed cherries ripen faster and accumulate more sugar. The shaded cherries lag behind. This is why selective harvesting — multiple passes through the same trees over several weeks — is so important for quality. The Coffee Quality Institute's field variability study found that within a single well-managed coffee block, the TDS variation between the highest and lowest sections averaged 2.8 percent. A block with TDS variation exceeding 4 percent produces coffee that will cup inconsistently, with some bags scoring 84 and others scoring 80. Reducing field-level variation through uniform pruning, fertilization, and irrigation is one of the most effective ways a farm can improve its quality grade.
How Can Buyers Use Cherry Juice TDS in Their Sourcing Decisions?
If you are a coffee buyer, you may never visit the farm to measure TDS yourself. But you can and should ask your suppliers for this data.
What Questions Should You Ask Suppliers About Cherry Ripeness?
Ask your supplier to provide the average cherry juice TDS at harvest for the lot you are considering. A well-managed supplier will have this data. If they do not measure it, ask how they determine harvest timing. If the answer is just a calendar date, that is a warning sign. Harvest timing should be determined by cherry ripeness, not by the calendar. The Green Coffee Association's supplier transparency standards recommend that suppliers report harvest TDS data as part of the standard quality documentation for any specialty-grade lot. If a supplier cannot provide it, request a sample from a lot where they did measure it. The data correlates so strongly with cup quality that it is worth switching suppliers to get it. Buyers who consistently source from TDS-monitored farms report 3 to 5 percent fewer quality rejections per year.
Can TDS Data Help You Forecast Crop Quality Before the Harvest Season?
Yes, and this is where the data becomes a strategic advantage. If you track TDS readings from the same farms year over year, you can see trends before anyone else. A farm whose average TDS drops from 21.5 percent to 19.8 percent over two seasons is experiencing a systemic quality decline that needs investigation — possible soil depletion, climate stress, or aging trees. The World Coffee Research seasonal forecasting program has been collecting TDS data from partner farms since 2019. The data shows that early-season TDS readings at 60 days before harvest predict the final harvest TDS with 64 percent accuracy. That gives buyers a 2-month window to adjust their sourcing plans. If a farm you rely on is trending low, you can line up alternative suppliers before the harvest even begins.
Conclusion
Cherry juice TDS is a fast, cheap, and reliable predictor of coffee quality. A single 50-cherry sample measured with a 150 dollar refractometer tells you more about a lot's quality potential than altitude or variety alone. The target range for specialty-grade Arabica is 20 to 22 percent. Below 18 percent means underripe cherries and high Quaker risk. Above 22 percent means exceptional sweetness and quality potential. If you are serious about sourcing consistently excellent coffee, ask your suppliers for cherry juice TDS data. If they do not measure it, ask why. At BeanofCoffee, we track TDS across every block of our plantation and use it to guide harvest timing and quality sorting. When we ship you a lot, we can tell you exactly how ripe the cherries were on the day they were picked. Contact Person: Cathy Cai Email: cathy@beanofcoffee.com