A quality control manager from a large-scale roastery in Seoul visited our Yunnan facility last year with a refractometer in his bag. He did not use it to measure brewed coffee strength. He used it to measure the TDS of green bean extracts. He told me that the TDS of a cold-water extraction of green coffee can predict the potential flavor development of the lot before it is even roasted. I was skeptical at first, but after seeing his data and replicating the tests, I became convinced. A refractometer is not just a brewing tool. It is a predictive quality instrument that can tell you more about a green coffee lot in 10 minutes than a full cupping can in 30. Let me walk you through the method.
How Can a Refractometer Predict Green Coffee Quality?
The principle is straightforward. Green coffee beans contain soluble solids — sugars, amino acids, chlorogenic acids, and minerals — that dissolve in water. The concentration of these solubles, measured as total dissolved solids, correlates with the flavor potential of the coffee after roasting. Higher TDS in the green extraction generally indicates greater potential for flavor development.
What Does the Green TDS Number Tell You About Quality?
The green TDS reading measures the total soluble material that the bean can release. This includes the precursors that will become flavor compounds during roasting. A green coffee with a high extraction TDS has more raw material to work with. All else being equal, it will produce a more flavorful cup than a coffee with low green TDS. The World Coffee Research green TDS study found that the correlation between green extraction TDS and final cupping score is 0.68 to 0.74, depending on the origin and processing method. That is stronger than the correlation between screen size and cupping score, and comparable to the correlation between density and cupping score. For a quick, nondestructive test, green TDS is remarkably effective.
What Is the Ideal Green TDS Range for Specialty Arabica?
The green TDS range for specialty-grade Arabica is 3.5 to 5.5 percent using a standard extraction protocol. Coffee measuring below 3.0 percent TDS tends to cup flat and hollow, with low sweetness and thin body. Coffee above 6.0 percent TDS is rare and typically indicates either a very dense, high-altitude bean or a processing anomaly that should be investigated. At Shanghai Fumao, we have tested over 200 lots of Yunnan Catimor with this method. Our high-grown washed Catimor consistently reads between 4.0 and 5.0 percent green TDS, which correlates with cupping scores of 83 to 86 points. Lots below 3.5 percent TDS are flagged for investigation before they proceed to export.
What Is the Standard Protocol for Green Coffee TDS Measurement?
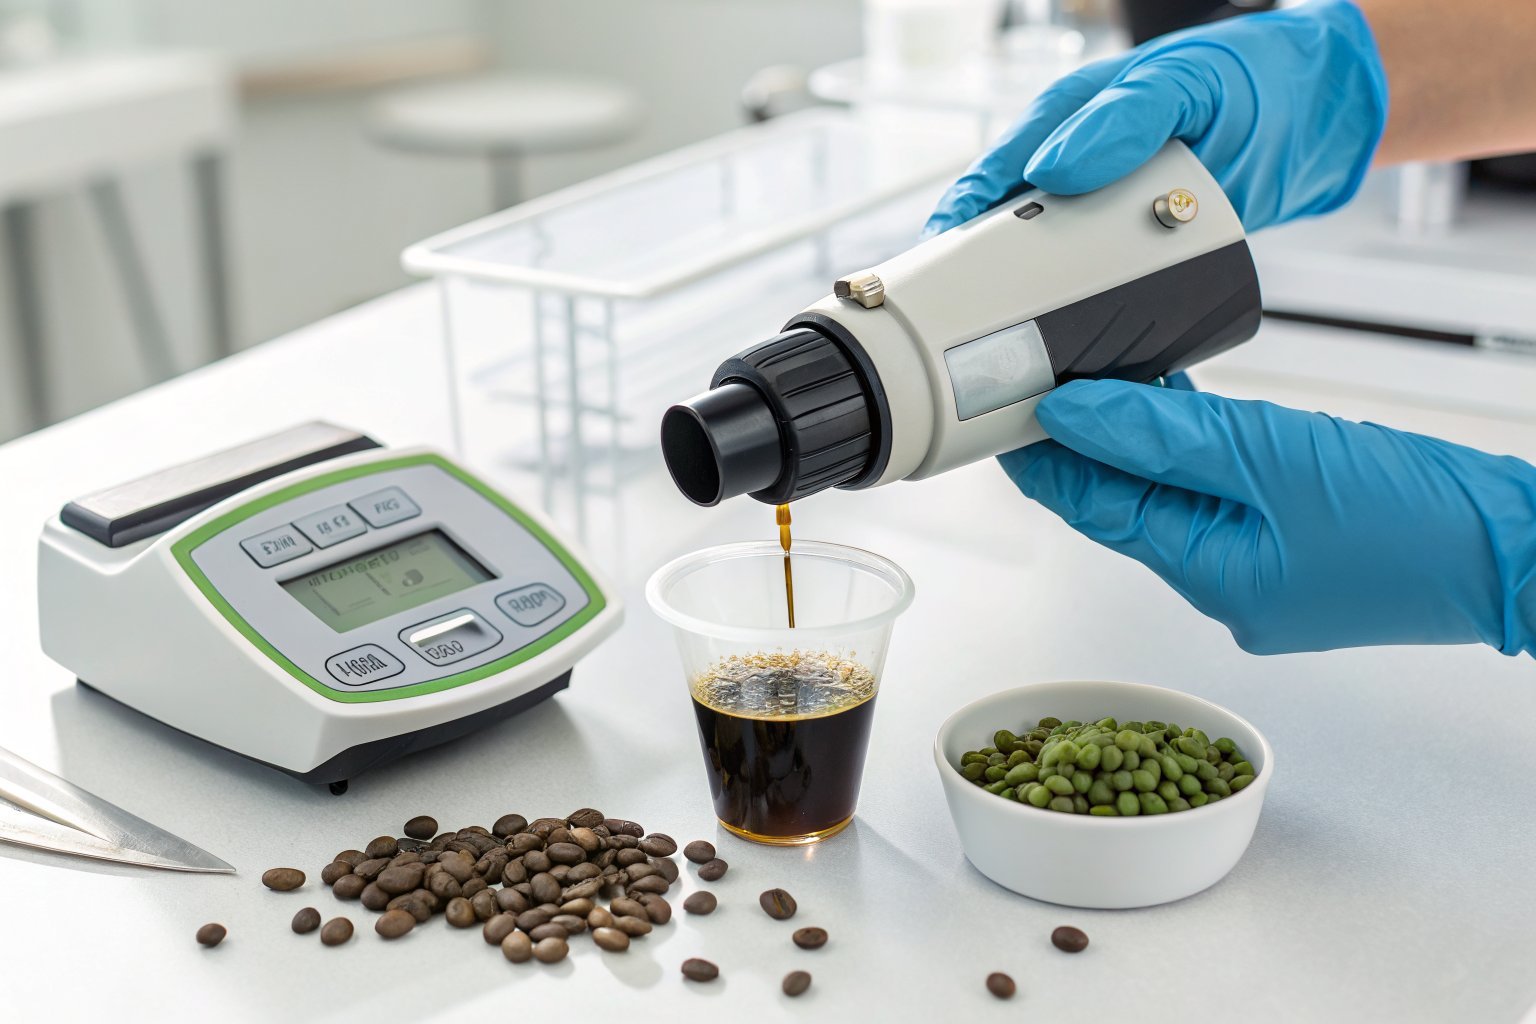
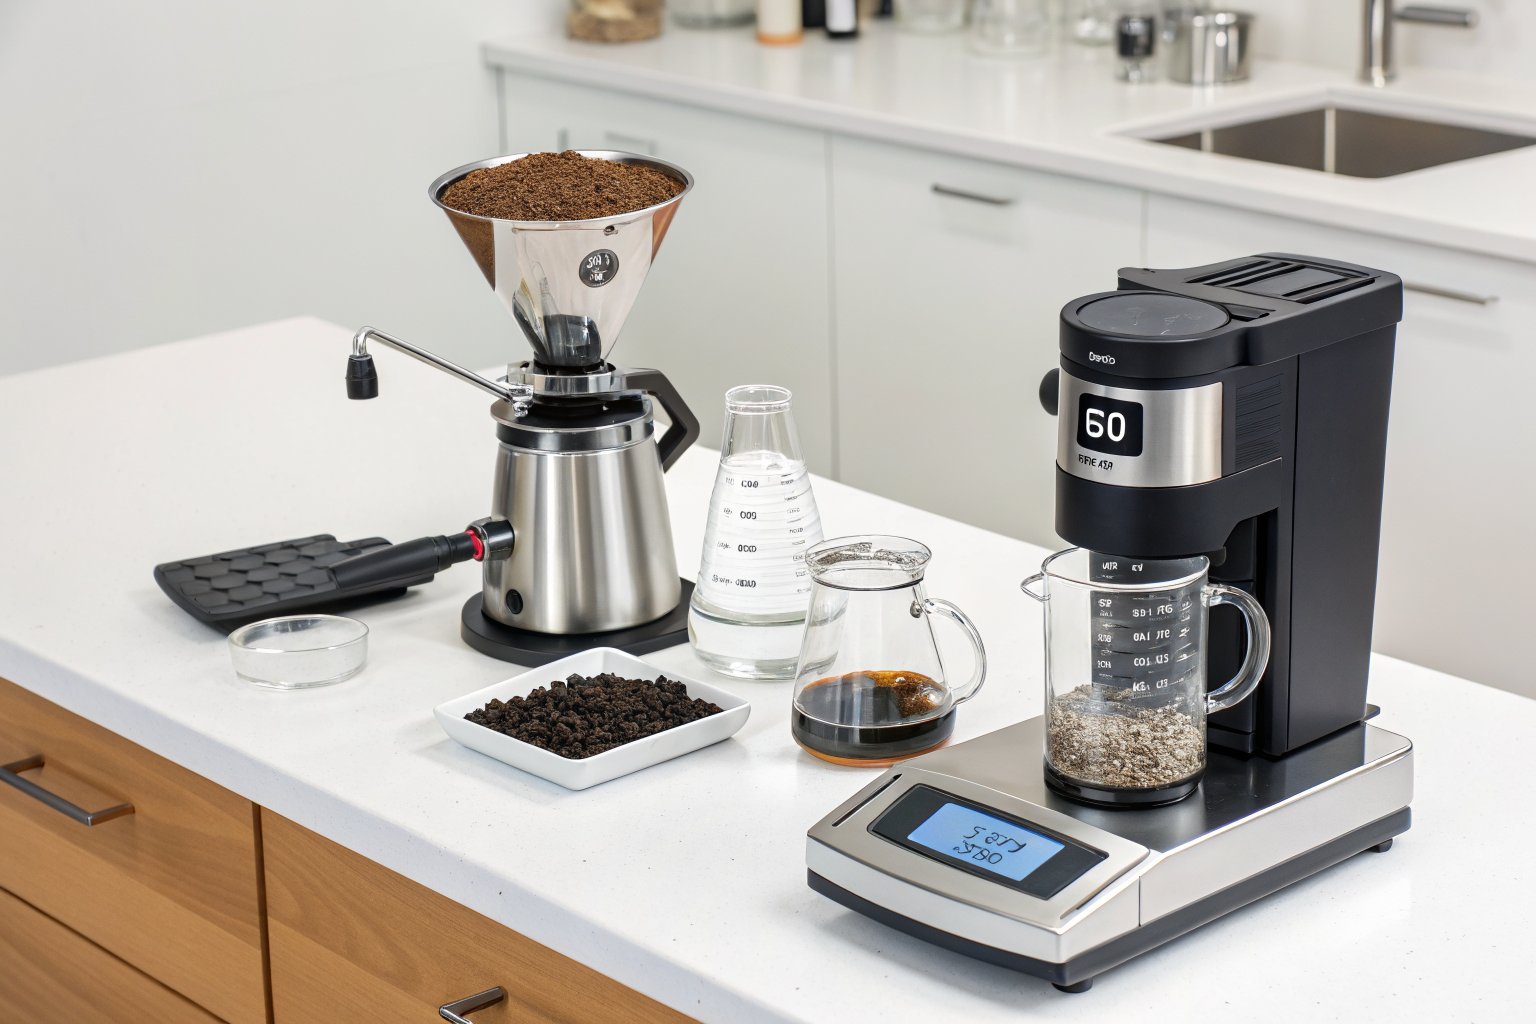
The test is simple and requires only a refractometer, a precision scale, a grinder, and filtered water. The entire process takes about 10 minutes.
What Is the Exact Extraction Procedure?
Grind 5 grams of green coffee to the consistency of drip coffee — approximately 500 to 600 microns. Add 100 grams of filtered water at 20 to 22 degrees Celsius. Stir for 30 seconds, then let the mixture sit for 5 minutes. Filter the liquid through a paper coffee filter into a clean cup. The first 10 milliliters that pass through are discarded, and the next 5 milliliters are used for the reading. Place a drop on the refractometer prism and record the TDS. The Specialty Coffee Association's green TDS protocol specifies that the water temperature should be controlled to plus or minus 1 degree Celsius, because extraction efficiency increases with temperature. A 5-degree difference can shift the reading by 0.3 to 0.5 percent TDS. The grind size should be consistent — too fine and you over-extract, too coarse and you under-extract.
How Do You Interpret the Results Across Different Origins?
The green TDS numbers vary by origin, altitude, and variety, so you need to establish baselines for the specific coffees you buy. A washed Ethiopian Yirgacheffe might read 4.5 to 5.5 percent, while a washed Yunnan Catimor reads 4.0 to 5.0 percent. The absolute number matters less than the ranking within an origin. Sort your incoming lots by green TDS, and you will see a clear correlation with cupping scores at the origin level. The Coffee Quality Institute's origin TDS baselines provides reference ranges for major coffee origins. For Yunnan washed Arabica, the reference range is 3.8 to 5.2 percent. If you test a Yunnan lot at 3.2 percent, it is unlikely to be specialty grade regardless of what the supplier claims.
How Do You Use Green TDS Data in Your Buying Decisions?
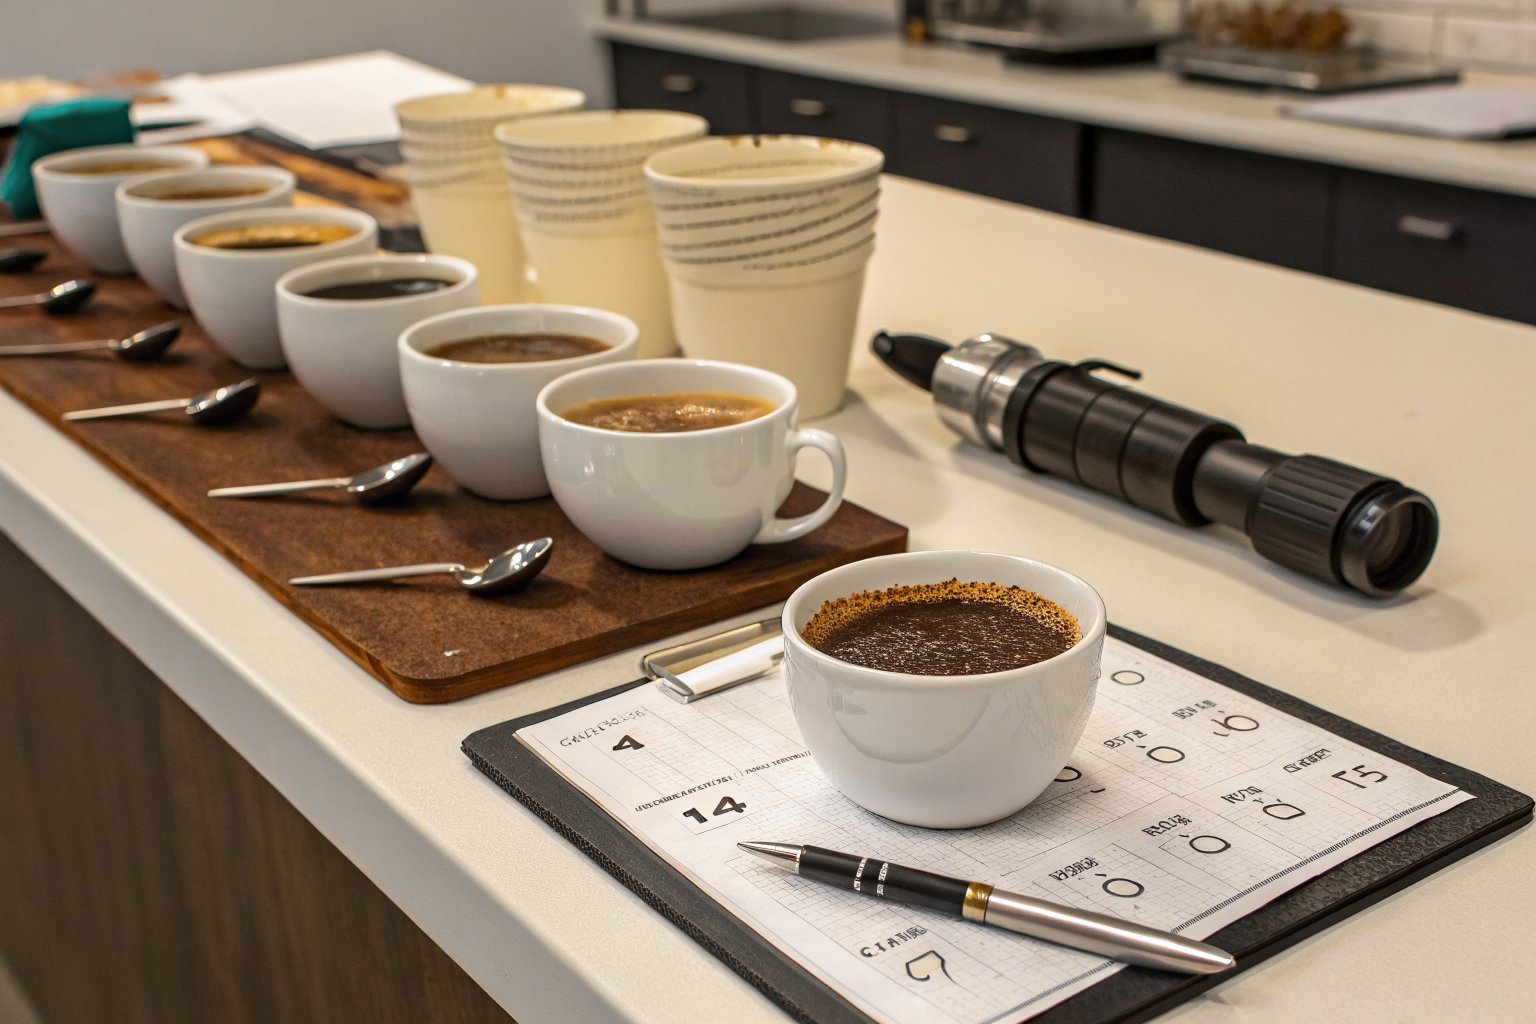
Green TDS is not a replacement for cupping. It is a screening tool that lets you prioritize which lots to cup and which to pass on. Used correctly, it saves time and reduces the risk of buying disappointing coffee.
How Do You Combine Green TDS with Other Quality Indicators?
The most effective approach is a three-stage screening process. First, measure green TDS on all incoming samples. Lots below your origin-specific threshold are deprioritized. Second, measure density on the lots that pass the TDS screen. Lots with both high TDS and high density are your highest priority for cupping. Third, cup only the top 30 to 40 percent of lots that cleared both screens. This approach reduces your cupping volume by 60 to 70 percent while maintaining 85 to 90 percent accuracy in identifying the best lots. The Green Coffee Association's multi-stage screening protocol found that buyers using this method reduced their per-lot evaluation cost by 45 percent while maintaining the same average cupping score in their purchases.
Can Green TDS Help You Detect Processing Defects?
Yes, and this is one of the most valuable applications. An abnormally high green TDS can indicate over-fermentation, where the breakdown of the mucilage during processing releases additional soluble material into the bean. An abnormally low green TDS can indicate that the beans were over-washed or that the cherries were picked too early. At Shanghai Fumao, we use green TDS as a processing quality check on every lot. If a washed lot comes in at 5.5 percent TDS when the farm average is 4.5 percent, we investigate the processing records. In some cases, the high TDS correlates with an extended fermentation that created undesirable flavor notes. The green TDS reading flagged the problem before the coffee was shipped.
Can Green TDS Predict Roast Development Behavior?
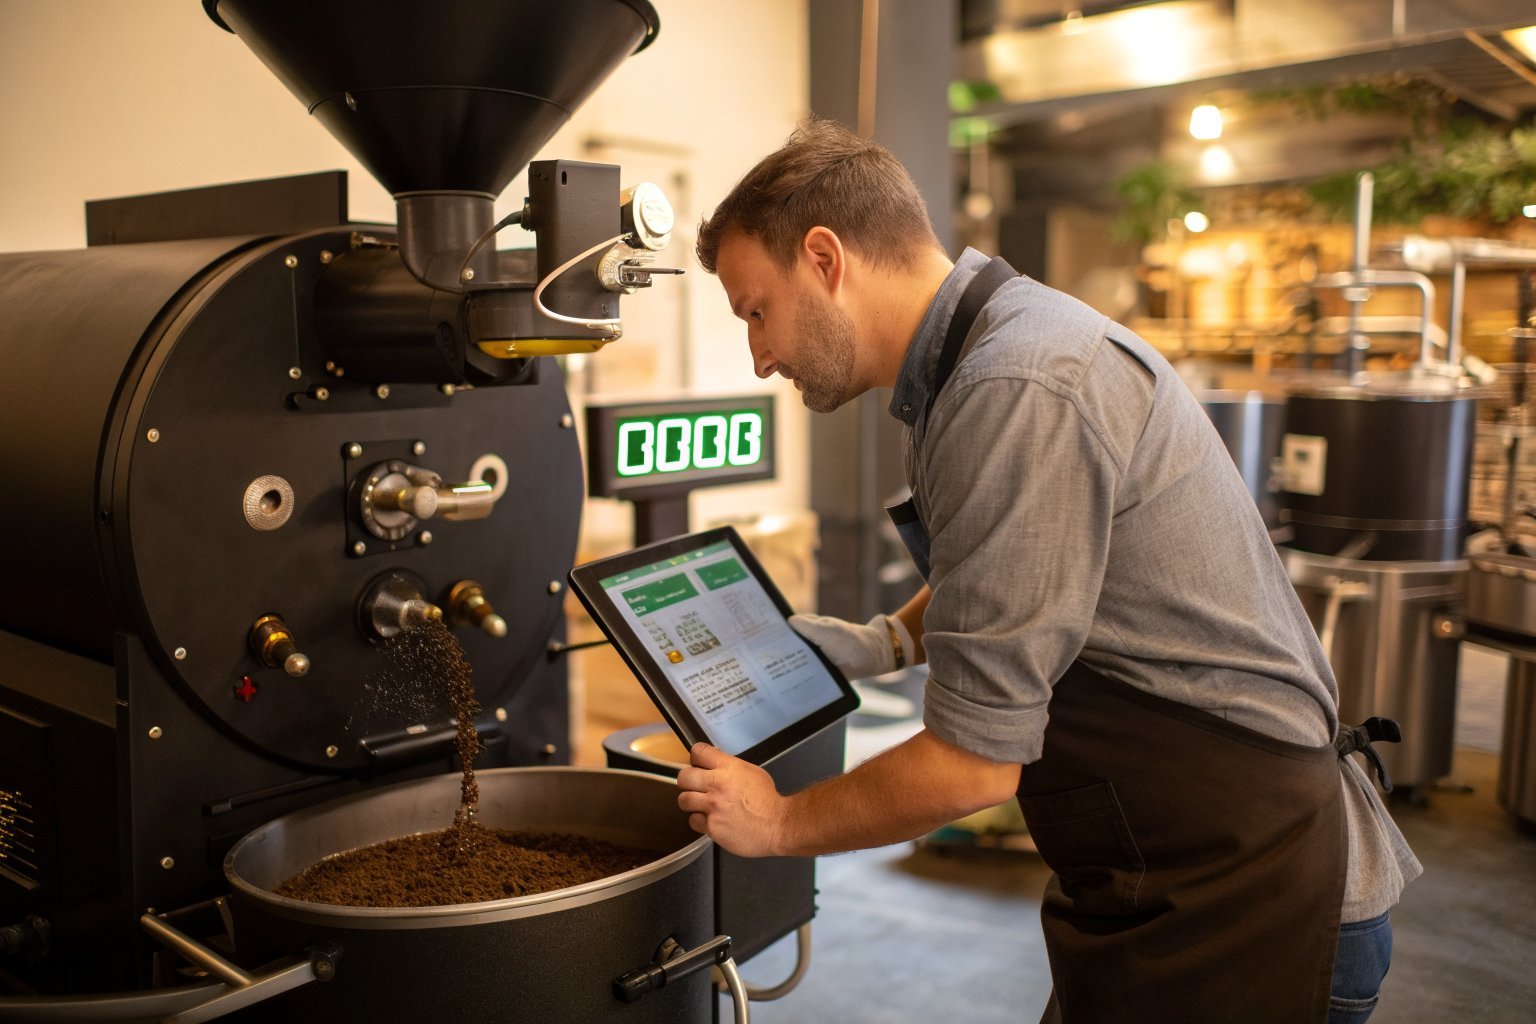
One of the most practical uses of green TDS is predicting how a coffee will behave in the roaster. The TDS reading correlates with the bean's internal sugar content, which affects the rate of Maillard browning.
How Does Green TDS Affect Roast Development Time?
Coffee with higher green TDS tends to go through the Maillard phase faster because there is more sugar available for browning reactions. A coffee at 5.0 percent green TDS might reach first crack 15 to 20 seconds sooner than the same variety at 3.5 percent TDS, given identical roast conditions. The difference is consistent enough that you can adjust your charge temperature and energy input based on the TDS reading. The Roast Magazine's green TDS roasting study found that a 1 percent increase in green TDS correlated with a 1.2 to 1.8 degree Celsius reduction in the temperature at which first crack occurred. Roasters who used green TDS data to adjust their profiles reduced batch-to-batch color variation by 22 percent compared to roasters who used a fixed profile for all lots.
Can You Predict Optimal Development Time from Green TDS?
The optimal development time after first crack also correlates with green TDS. High-TDS coffees can tolerate longer development times — up to 25 percent of total roast time — without developing baked flavors. Low-TDS coffees need shorter development times of 15 to 18 percent of total roast time, because the limited sugar supply will burn quickly if extended. The World Coffee Research development time model provides a guideline: development time as a percentage of total roast time equals 15 plus 1.5 times the green TDS. For a coffee at 4.0 percent TDS, development time should be approximately 21 percent of total roast time. For a coffee at 5.0 percent, approximately 22.5 percent. Using this formula rather than a fixed development time improves cupping scores by an average of 0.8 points across a range of origins and roast levels.
Conclusion
A refractometer is not just for checking extraction yield on the brew bar. It is a fast, cost-effective tool for predicting green coffee quality before you roast. The standard protocol — 5 grams of green coffee ground to drip consistency, extracted in 100 grams of water at room temperature for 5 minutes — gives you a TDS reading that correlates with cupping score, roasting behavior, and processing quality. Use it as a screening tool alongside density and screen size to prioritize your cupping samples and reduce evaluation time. At BeanofCoffee, we test every lot with green TDS measurement and share the data with our buyers. When you buy from us, you get not just a cupping score but the physical data that supports it. Contact Person: Cathy Cai Email: cathy@beanofcoffee.com Website: https://beanofcoffee.com/